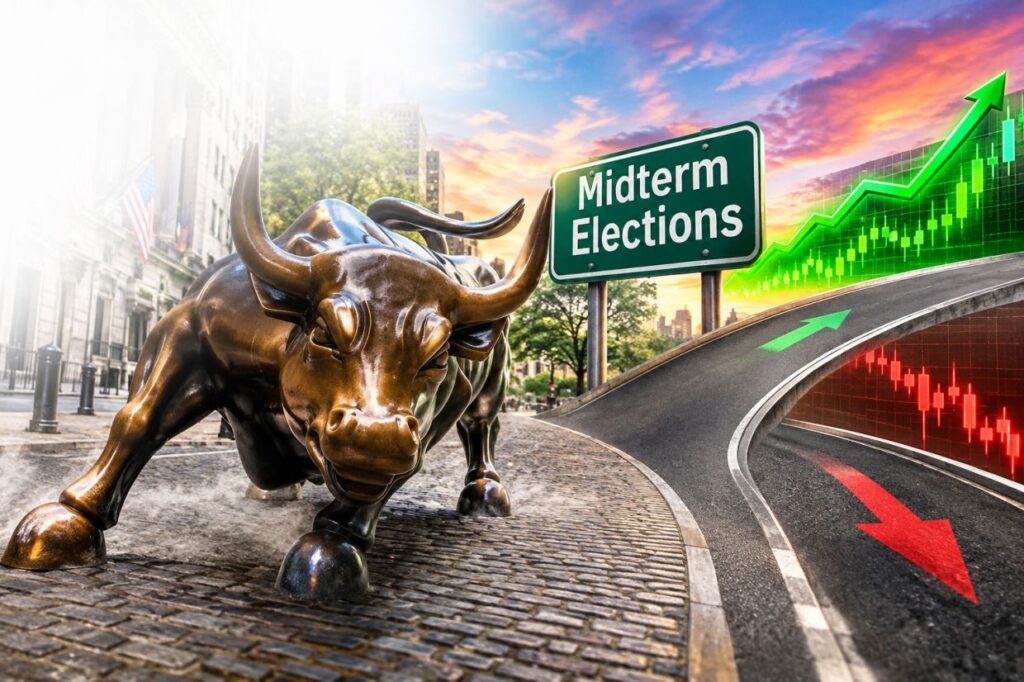
The US stocks midterm rally question is back on the table after a sharp sell-off. Wall Street shed US$3.2 trillion following the Republicans’ electoral drubbing on Tuesday. Reuters reports that the fall is now testing whether the usual post-midterm pattern still holds.
Why Did US Stocks Fall After the Midterms?
US chip stocks plunged 12% last Thursday, their second-biggest fall on record. Investors feared the Democratic-controlled Congress could slow the buildout of artificial intelligence (AI) data centres.
Does the S&P 500 Usually Rally After Midterms?
Yes, according to the historical record. The S&P 500 has risen in the 12 months after every midterm election since 1950, gaining around 15% on average.
Between 1946 and 2022, the market was up 100% of the time after the vote. The average gain was 14.4% and the median return was 13.7%.
Deutsche Bank analysts put the wider post-World War Two record at a 71% chance of a rise in any calendar year, with an average gain of just over 9% and a median rise of 11.6%. The post-midterm advantage works out to roughly four to five percentage points on average and about two points at the median.
Why Do Midterm Years Lag Behind?
Keith Lerner, chief investment officer at Truist Wealth Advisory, puts the S&P 500’s average rise in midterm years since 1949 at only 8.4%. Uncertainty over the vote, balance-of-power shifts and policy implications builds before the election.
Once the vote is done, that uncertainty is removed. Divided government and political gridlock also reduce the likelihood of major, radical policy changes.
What Makes the Third Year of a Presidential Term Stronger?
Lerner notes that the US economy has never been in recession during the third year of a presidential term, the calendar year after the midterms. The S&P 500’s average return in those years is 20.9%, above years one, two and four of the cycle.
- Stimulative fiscal policy enacted in the first two years often takes time to filter through.
- US Federal Reserve (Fed) rate hikes historically have not bitten in that window.
Is This Midterm Different?
The S&P 500 is still just 5% below its all-time high even after last Thursday’s sell-off. That leaves limited room for further strong gains, analysts note.
Before the slump, the index’s maximum drawdown this year was only 9%. That is about half the typical maximum pullback of 18% to 19% in a midterm year, according to JPMorgan.
Why Is the US Stock Market So Concentrated?
Earnings, returns, market capitalisation and investment have never revolved around so few companies. The concentration sits in three groups that are worth monitoring:
- Magnificent Seven: the Big Tech giants.
- Hyperscalers: the firms at the heart of the AI revolution.
- AI-adjacent companies: dozens of firms involved in the wider buildout.
AI spending is expected to top US$10 trillion between 2025 and 2032, according to some estimates. Observers say this is inflating a huge bubble, with parallels to the dotcom boom and bust. For readers following AI-linked names, AI Stock Analysis for Malaysians covers how investors can track this theme.
Can Fed Rate Hikes Derail the Midterm Rally?
The Fed raised rates by a quarter of a percentage point in September. Financial markets are betting on another half-point hike next year, bringing cumulative tightening to 75 basis points (bps).
The average tightening cycle since 1954 has been 400 bps and lasted 23 months, according to the Fed Bank of Chicago. Markets are therefore positioned for the mildest tightening cycle in Fed history.
If conflicts in the Middle East and Ukraine keep energy prices elevated, the Fed could face stagflation. Post-midterm Fed policy also shows no consistent playbook, with the central bank having hiked, eased or held rates in different cycles.
What Are the Exceptions to the Midterm Rally?
Only two years broke the post-midterm outperformance pattern in almost a century: 1930 and 1938. The 12 months that followed were marked by the Great Depression and the buildup to World War Two.
If the pattern holds and the United States avoids recession in 2027, investors could be in for a strong year. Recession is not many people’s base case, but the turbulence in tech stocks risks triggering a deeper economic downturn.
Disclaimer: This article is for general information only and does not constitute investment advice or a recommendation to buy, sell or hold any security. Always do your own research before making investment decisions.
Key Takeaways
- Wall Street shed US$3.2 trillion after the midterms, and US chip stocks fell 12% last Thursday.
- The S&P 500 has risen in the 12 months after every midterm since 1950, gaining around 15% on average.
- The S&P 500 sits 5% below its all-time high, with a 9% maximum drawdown this year before the slump.
- Markets are pricing the mildest Fed tightening cycle in history, against a 400 bps average since 1954.
Frequently Asked Questions
Do US stocks usually rise after midterm elections?
Yes. The S&P 500 has risen in the 12 months after every midterm election since 1950, gaining around 15% on average. Between 1946 and 2022, it was up 100% of the time after the vote, with a median return of 13.7%.
How much did Wall Street fall after the midterms?
Wall Street shed US$3.2 trillion after the Republicans’ electoral drubbing on Tuesday. US chip stocks plunged 12% last Thursday, their second-biggest fall on record.
How far is the S&P 500 from its all-time high?
The S&P 500 is still 5% below its all-time high, even after last Thursday’s sell-off. Before the slump, its maximum drawdown this year was 9%, according to JPMorgan.
What is the average S&P 500 return in the third year of a presidential term?
Keith Lerner of Truist Wealth Advisory calculates an average S&P 500 return of 20.9% in that year. The US economy has never been in recession during the third year of a presidential term since 1950.
Source: View Original Article — The content is based on the original publisher. Refer to the original content for accurate info. Contact us for any changes.
Related Articles & Resources
Disclaimer: This article is for informational purposes only and does not constitute financial advice. Always do your own research before making investment decisions.
Want to invest in Bursa Malaysia or US markets? Contact Dexter Chia, an AI Driven Remisier who has 2,300+ clients at Malacca Securities Sdn Bhd (M+ Global). M+ Global Invitation Code: UBZQ | WhatsApp: +60169059789 | Why Choose Dexter?