Read in Bahasa Malaysia · 中文
I’m Dexter Chia, a licensed dealer’s representative (R336) at Malacca Securities (M+ Global). When I review the US market, I find that the headline index number only tells part of the story. This page gives you a wider view of how the market is behaving underneath. If you invest in Malaysia but keep an eye on Wall Street, it is a useful place to start your day. Check today’s US market breadth on the terminal.
What does US market breadth actually tell you?
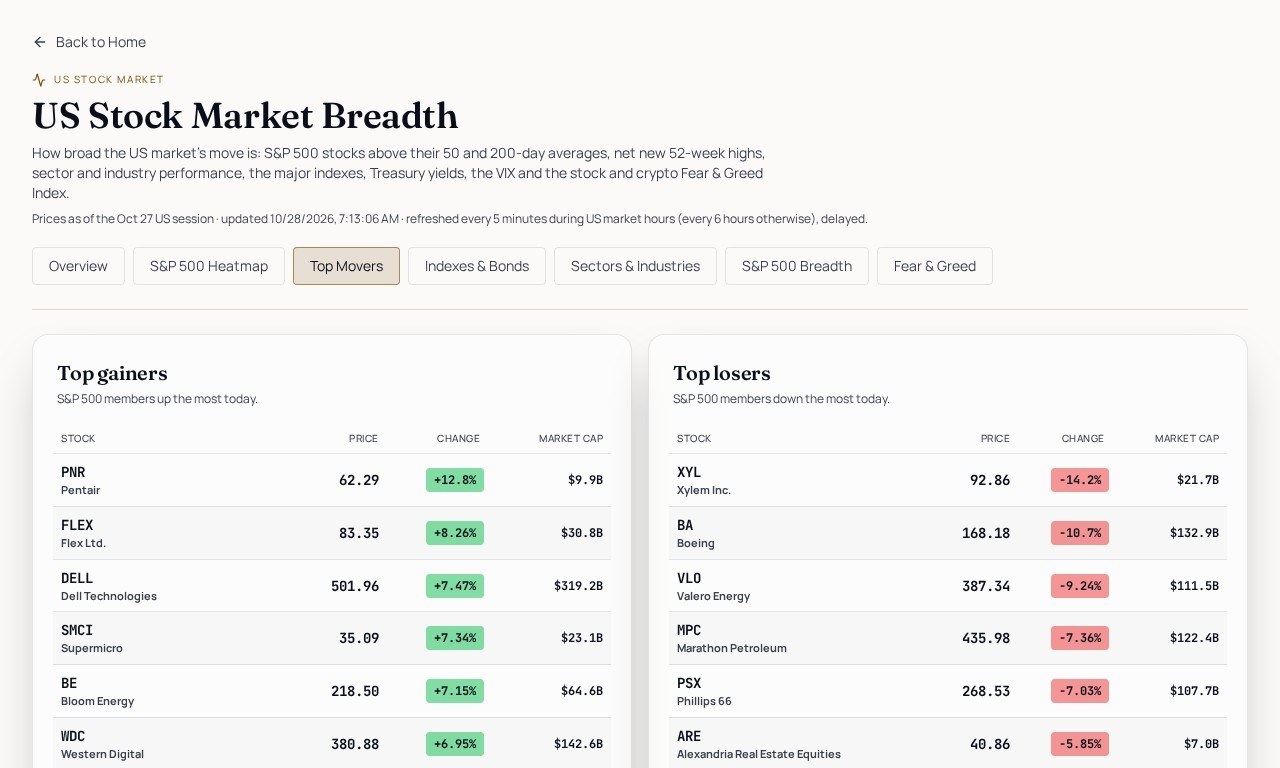
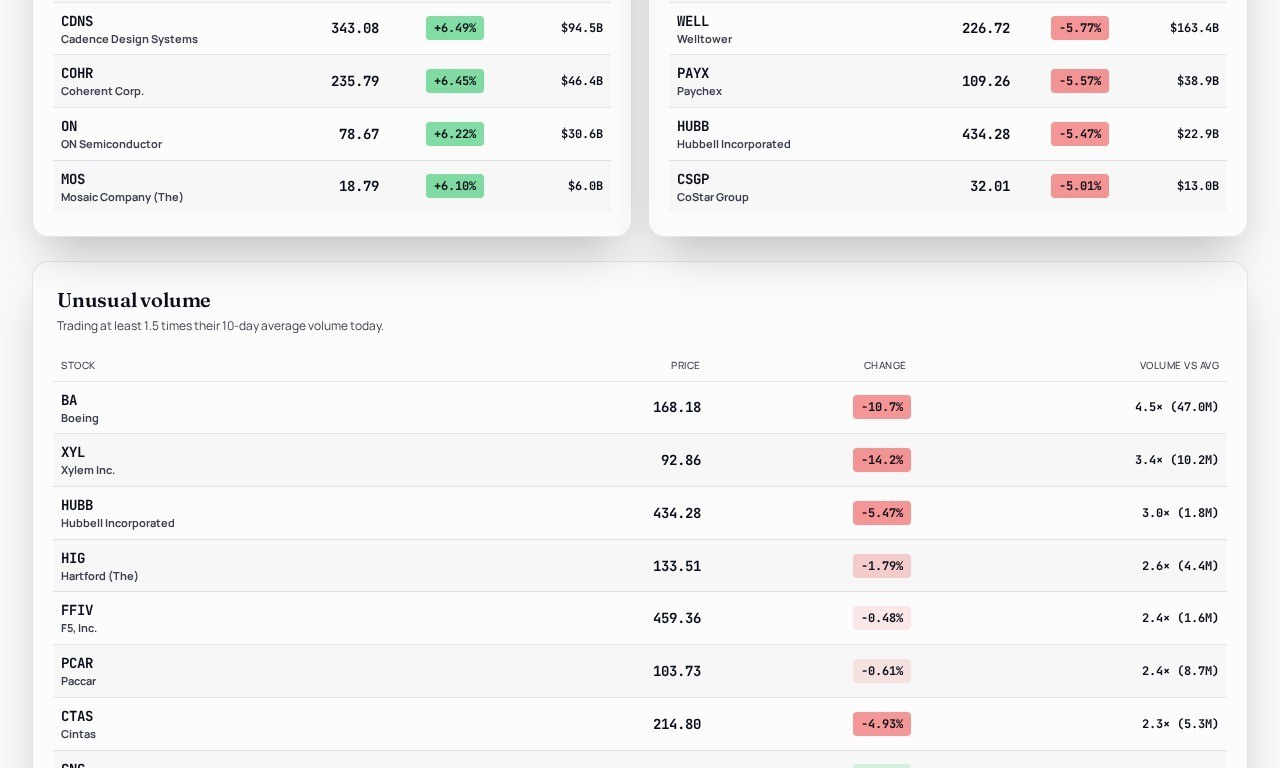
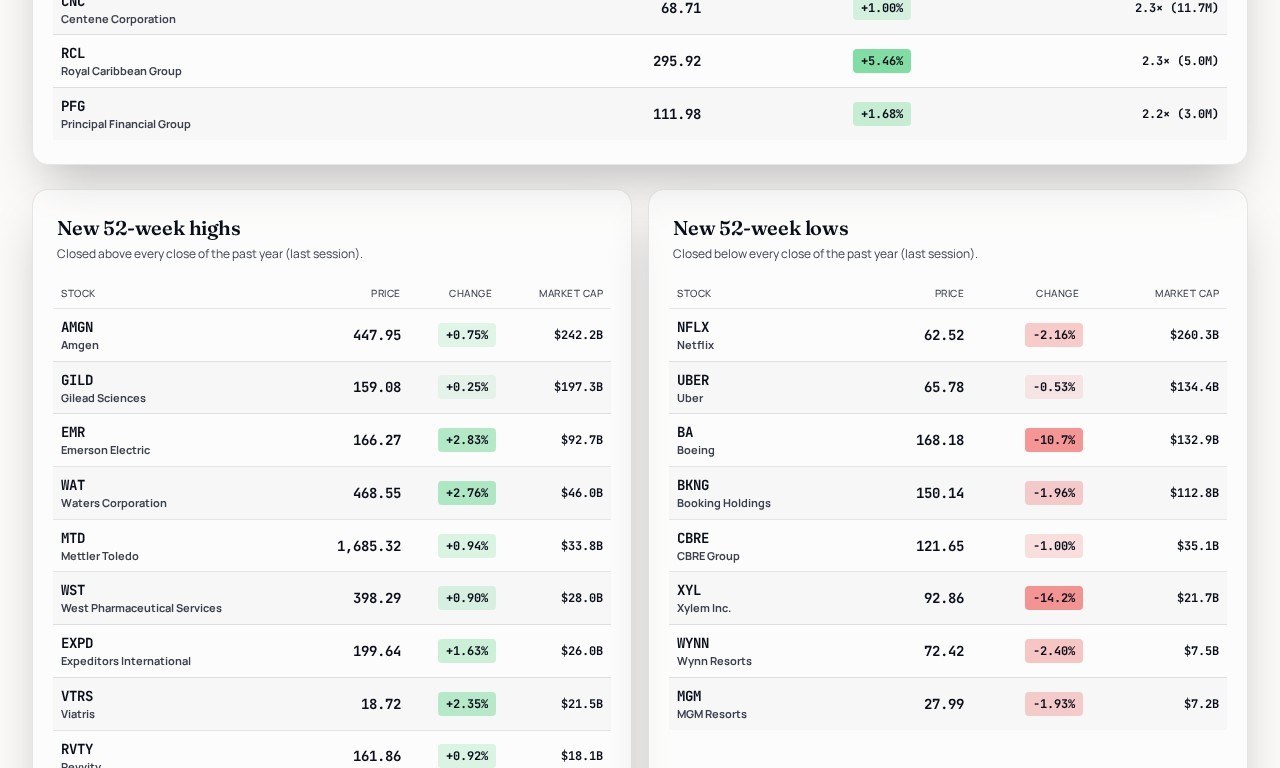
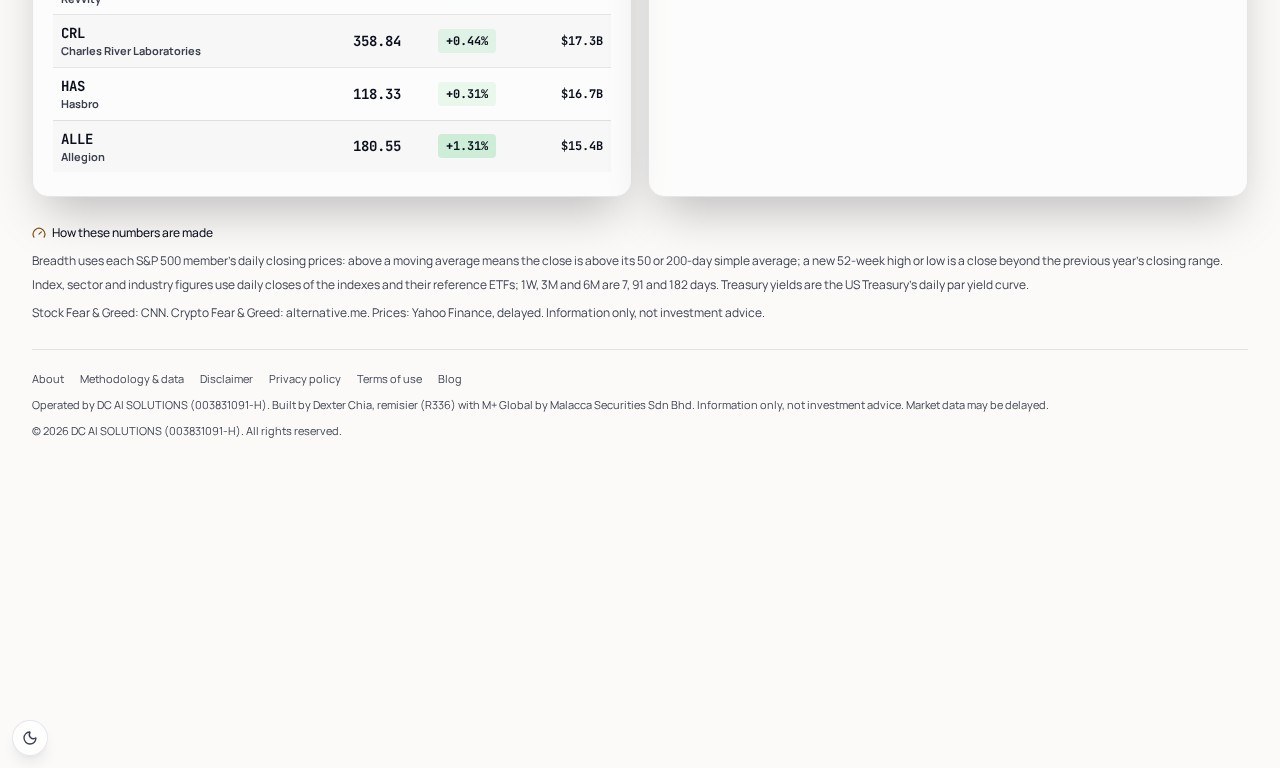
Breadth measures how many stocks take part in a market move. An index can rise while only a handful of large companies are doing the work. The page tracks how many S&P 500 stocks are above their 50-day and 200-day moving averages, along with net new highs. On 27 Oct 2026, 60.2% of S&P 500 stocks closed above their 50-day average and 58.8% above their 200-day average. There were 12 new 52-week highs and 8 new lows that day. Readings like these help you judge whether a move is broad or narrow.
How did the major indexes and sectors perform?
The page lists the major US indexes with returns over one day, one week, one month, three months, six months and one year. On the snapshot date, the S&P 500 closed at 7,722.6, up 0.60% on the day and 12.33% over one year. The Nasdaq 100 rose 1.29% on the day to 29,651.44. The Russell 2000 gained 1.16%, while the S&P SmallCap 600 gained 0.54%.
The sector table makes it easier to see where money is moving. Technology was up 1.70% on the day and 26.75% over one year. Energy was down 2.05% on the day but up 54.53% over one year. Communication Services fell 6.00% over one week and is down 11.59% over one year. The industry table goes deeper. Semiconductors rose 4.69% on the day, and Metals & Mining rose 4.68%.
Why do Treasury yields and Fear & Greed matter?
Treasury yields are part of the backdrop for stock valuations. The page shows the 2-year at 4.70%, the 10-year at 4.99% and the 30-year at 5.30%. Changes are shown in basis points across the same time periods. The 10-year yield, for example, was down 18 basis points over one month but up 98 basis points over one year.
The Fear & Greed readings add a sentiment layer. CNN’s stock market index stood at 34, which means fear. The crypto Fear & Greed Index was at 51, which is neutral. Sentiment gauges are context, not trading signals. They tell you how nervous or confident the crowd feels, which can be useful when you are reviewing your own plan.
Who is this page for?
This page suits Malaysian investors who follow US equities, those who want a quick morning read on the Wall Street backdrop before the local session, and anyone who likes to compare sectors, industries and indexes side by side. Beginners can use it to learn what breadth and sector rotation look like. Experienced investors may find it handy as a quick reference.
How do you use the page step by step?
Here is a simple routine based on what the page shows:
- Open the US market breadth page and note the date of the snapshot.
- Check the breadth figures. Compare the share of stocks above their 50-day and 200-day averages, and the ratio of new highs to new lows.
- Compare the major indexes across time periods. Look at whether the S&P 500, Nasdaq 100, Dow and small-cap indexes are moving together.
- Scan the sector and industry tables. Identify which areas are leading or lagging over one month, three months and one year.
- Review Treasury yields to understand the interest rate backdrop.
- Read the Fear & Greed readings as context for overall sentiment.
- Write down your observations and compare them with your own research. Use the terminal’s other sections, such as KLSE quarterly results and company announcements, to connect the US picture with Bursa Malaysia.
Where does the IPO side fit in?
The terminal menu also includes a Malaysia IPO calendar. If you are interested in IPO applications, you can open an M+ Global account with invitation code UBZQ to apply for IPOs. Read each prospectus carefully and consider your own financial situation before applying. I do not recommend any specific IPO or stock on this page.
Frequently asked questions
Is this page a buy or sell signal?
No. The page presents market data, including breadth, indexes, sectors, yields and sentiment readings. It does not tell you what to buy or sell. Your decisions should reflect your own goals, risk tolerance and research.
What date does the data reflect?
The breadth and sentiment figures shown on the page are dated 27 Oct 2026. Always check the date on the page before using the numbers, because market data changes every trading day.
Do I need an account to read the page?
The page is for reading market data. The M+ Global invitation code is mentioned in relation to applying for IPOs. If you are considering an IPO application, you can open an account using code UBZQ.
Want to see the full US market picture for yourself? Open the US Stock Market Breadth Today page on AI Stock Trend Terminal and work through the numbers at your own pace.
For information only, not a recommendation to subscribe to any IPO. IPO shares can list below their offer price.