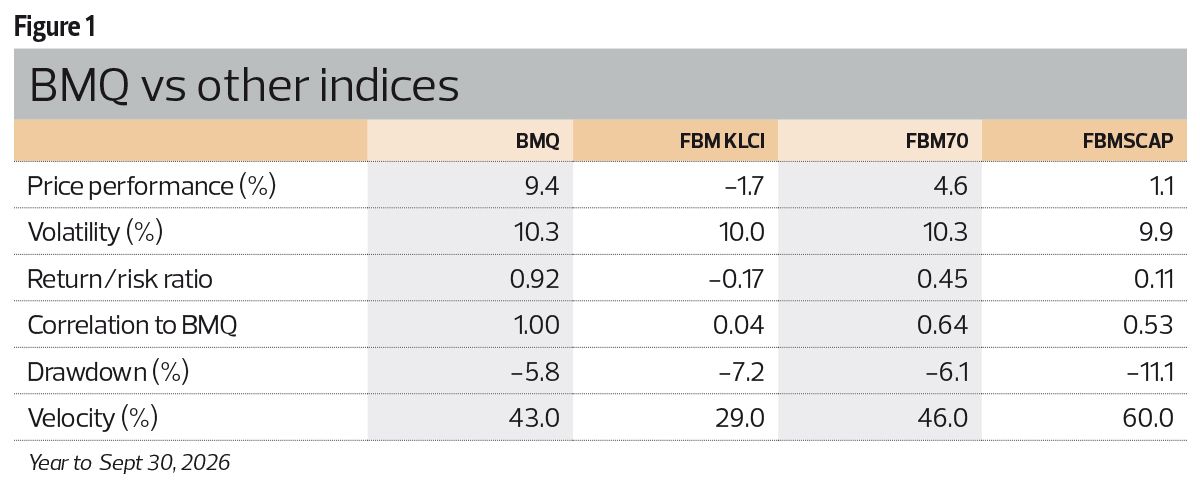
The Bursa Malaysia Quality 50 Index (BMQ) has gained 9.4% in its first nine months, while the FBM KLCI fell 1.7%. The index does not pick stocks by market capitalisation. It screens for quality, and the early data shows how that approach performs in a real market.
Why Did the Bursa Malaysia Quality 50 Index Beat the KLCI?
Over the same period, the FBM Mid 70 Index (FBM70) rose 4.6% and the FBM Small Cap Index (FBMSCAP) climbed 1.1%.
The BMQ tests companies on three quality measures, including debt-to-equity (D/E) for capital structure and operating cash flow relative to profit after tax and minority interest (OCF/Patami) for earnings quality.
Those tests ran through a difficult stretch. Geopolitical developments in West Asia, energy price swings, shifting monetary policy expectations and bouts of risk-off sentiment all challenged companies with quality factors.

Did the BMQ Earn Its Return With Higher Risk?
The volatility data says no. Annualised volatility was 10.3%, matching the FBM70 and slightly above the FBM KLCI’s 10.0% and the FBMSCAP’s 9.9%.
That lifted risk-adjusted performance. The BMQ’s return-to-risk ratio was 0.9, against -0.2 for the FBM KLCI, 0.4 for the FBM70 and 0.1 for the FBMSCAP.
Is the Bursa Malaysia Quality 50 Index Just a Mid- and Small-Cap Proxy?
The index does share some market behaviour with smaller stocks. Its correlations were 0.6 with the FBM70 and 0.5 with the FBMSCAP, but only 0.04 with the FBM KLCI.
Its constituents look different from those indices. Average ROE was 17.4%, versus 13.2% for the FBMSCAP and 7.6% for the FBM70.
Leverage shows the widest gap. Average total debt-to-equity was 15.8%, compared with 57.5% for the FBMSCAP and 72.9% for the FBM70.
How Large and Liquid Is the Quality 50 Universe?
As at Sept 30, 2026, BMQ constituents had a combined market capitalisation of RM208.6 billion, about 10% of Bursa Malaysia’s RM2.1 trillion.
They generated RM297.6 million in average daily trading value (ADV), around 9% of the market’s RM3.2 billion total.
- Trading velocity: the BMQ recorded 43%, above the FBM KLCI’s 29% and below the FBM70’s 46%. The FBMSCAP stood at 60%.
- Index rule: constituents need a minimum 12-month trading velocity of 10%.
Is Nine Months Enough to Prove Quality Investing Works?
No, and the analysis says so. A full market cycle will show how quality characteristics behave across different market, economic and interest-rate environments.
The early data shows the BMQ capturing its target traits: stronger profitability, healthier balance sheets and better earnings quality, while remaining liquid. Investors who want to screen similar metrics can read our AI Stock Analysis for Malaysians guide.
Key Takeaways
- The BMQ gained 9.4% in the first nine months of 2026, while the FBM KLCI declined 1.7%.
- Volatility matched the FBM70 at 10.3%, so the return did not come with materially higher volatility.
- Constituents averaged 17.4% ROE and 15.8% debt-to-equity, well below the FBM70’s leverage.
- A RM208.6 billion market capitalisation and RM297.6 million ADV make the index investable.
- Stocks worth monitoring include those in the index as the next full market cycle unfolds.
📊 On AI Stock Terminal: QUALITY quarterly results · QUALITY announcements
Disclaimer: This article is general information and not financial advice. Index performance does not guarantee future returns. Always do your own research before making any investment decision.
Frequently Asked Questions
How much did the Bursa Malaysia Quality 50 Index gain in 2026?
The Bursa Malaysia Quality 50 Index gained 9.4% in the first nine months of 2026. Over the same period, the FBM KLCI declined 1.7%.
What is the Bursa Malaysia Quality 50 Index?
It is a rules-based index that selects companies on quality measures, including debt-to-equity and operating cash flow relative to profit after tax and minority interest, rather than market capitalisation. Its constituents had a combined market capitalisation of RM208.6 billion as at Sept 30, 2026.
Is the Bursa Malaysia Quality 50 Index riskier than the KLCI?
Not on this data. Its annualised volatility was 10.3%, against 10.0% for the FBM KLCI, and its return-to-risk ratio was 0.9 versus -0.2.
What is the average ROE of Bursa Malaysia Quality 50 Index constituents?
Average ROE was 17.4%, higher than 13.2% for the FBMSCAP and 7.6% for the FBM70.
Source: View Original Article — The content is based on the original publisher. Refer to the original content for accurate info. Contact us for any changes.
Related Articles & Resources
Disclaimer: This article is for informational purposes only and does not constitute financial advice. Always do your own research before making investment decisions.
Want to invest in Bursa Malaysia or US markets? Contact Dexter Chia, an AI Driven Remisier who has 2,300+ clients at Malacca Securities Sdn Bhd (M+ Global). M+ Global Invitation Code: UBZQ | WhatsApp: +60169059789 | Why Choose Dexter?