What Happened to Korean Stocks on 12 and 13 October 2026?
The sell-off ran over two sessions:
| Day | KOSPI | SK hynix (Seoul) | Samsung Electronics |
|---|---|---|---|
| Mon, 12 Oct | −3.65% to 6,384.24, the lowest close since 11 August | −4.52% | −4.39% |
| Tue, 13 Oct (intraday) | Down more than 6%, below 6,000 | 1,464,000 won, −8.79% (11am) | 231,500 won, −7.58% |
At 9:47am on Tuesday the Korea Exchange triggered a sell-side sidecar, which pauses program sell orders for a few minutes when KOSPI 200 futures fall sharply. It was the first sell-side sidecar in about two months. Other chip names fell hard too, including Hanmi Semiconductor (−12.47%) and Samsung Electro-Mechanics (−9.55%).
Intraday figures change through the session; check the Korea Exchange or your broker for official closing prices.
Why Did South Korean Chip Stocks Plunge?
- US chip stocks fell overnight. On 12 October in the US, Micron dropped 3.88% and SanDisk 5.97%, setting a weak tone for Asian memory makers.
- China competition fears. China’s ChangXin Memory Technologies (CXMT) announced plans for next-generation DDR5 server memory products, raising worries about more competition in a market where SK hynix and Samsung lead.
- Doubts about the memory upcycle. Analysts have recently trimmed earnings forecasts as the pace of memory-chip price increases slows, and investors are questioning how long the AI-driven chip rally can last.
- Heavy foreign selling. Foreign investors sold Samsung Electronics and SK hynix in large volumes. Korea’s market is dominated by these two stocks, so their selling drags the whole index.
SK hynix: Stock Trend Analysis
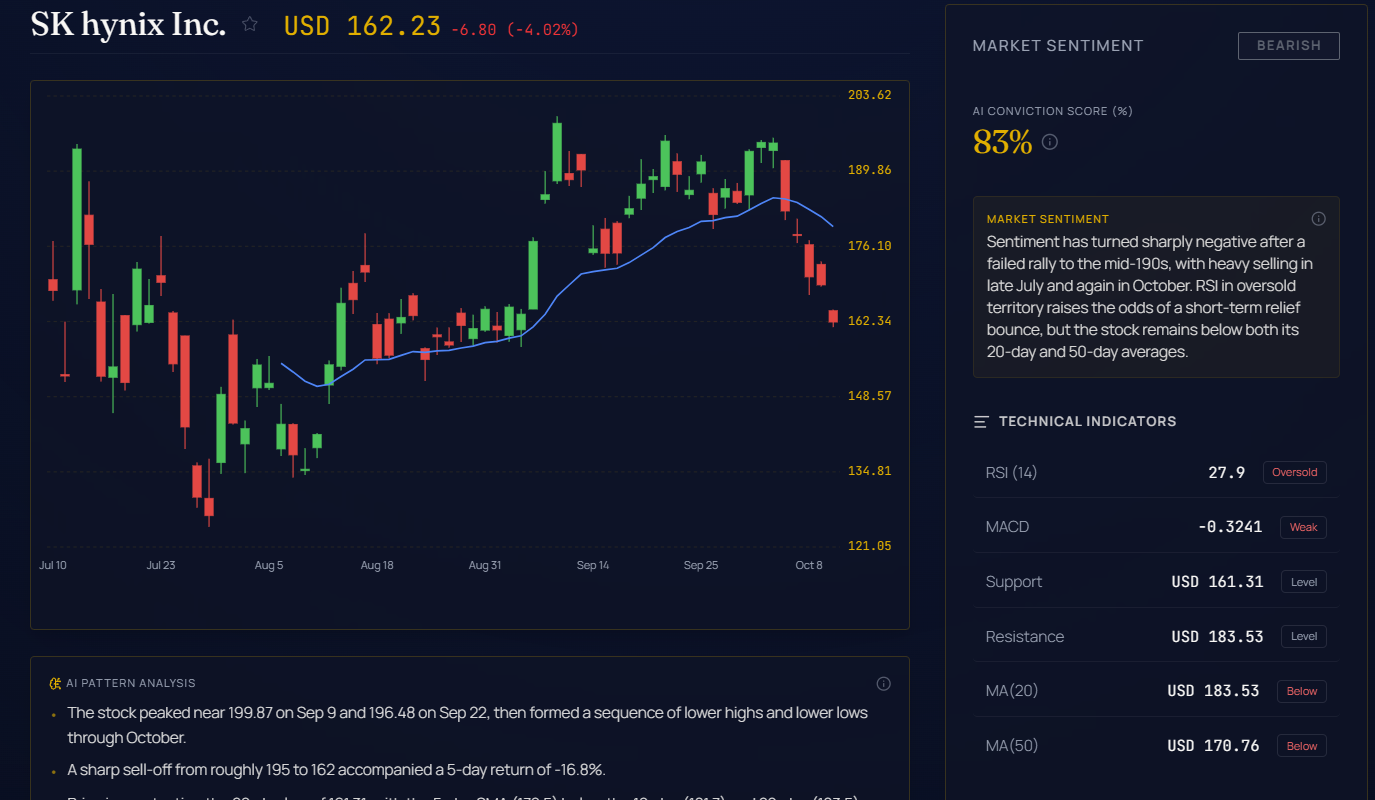
The AI Stock tool shows SK hynix’s US-dollar quote at USD 162.23 (−4.02%). Key readings:
| Indicator | Reading | What it means |
|---|---|---|
| RSI (14) | 27.9 | Oversold (below 30) |
| MACD | −0.3241 | Momentum negative |
| 20-day average | USD 183.53 | Price below; also the resistance level |
| 50-day average | USD 170.76 | Price below |
| Support | USD 161.31 | The recent 20-day low, being tested now |
- Lower highs since September. The stock peaked near USD 199.87 on 9 September and USD 196.48 on 22 September, then made lower highs and lower lows into October.
- A sharp five-day drop. It fell from roughly USD 195 to 162, a five-day return of −16.8%.
- Bearish short-term alignment. The 5-day average (172.5) is below the 10-day (181.7) and 20-day (183.5) averages.
- Wider range below. In July and August the stock traded in a broad range of about USD 124.8 to 178.
- No reversal pattern yet. There is no double bottom or similar base, although volume eased during the latest leg down.
EWY (iShares MSCI South Korea ETF): Stock Trend Analysis
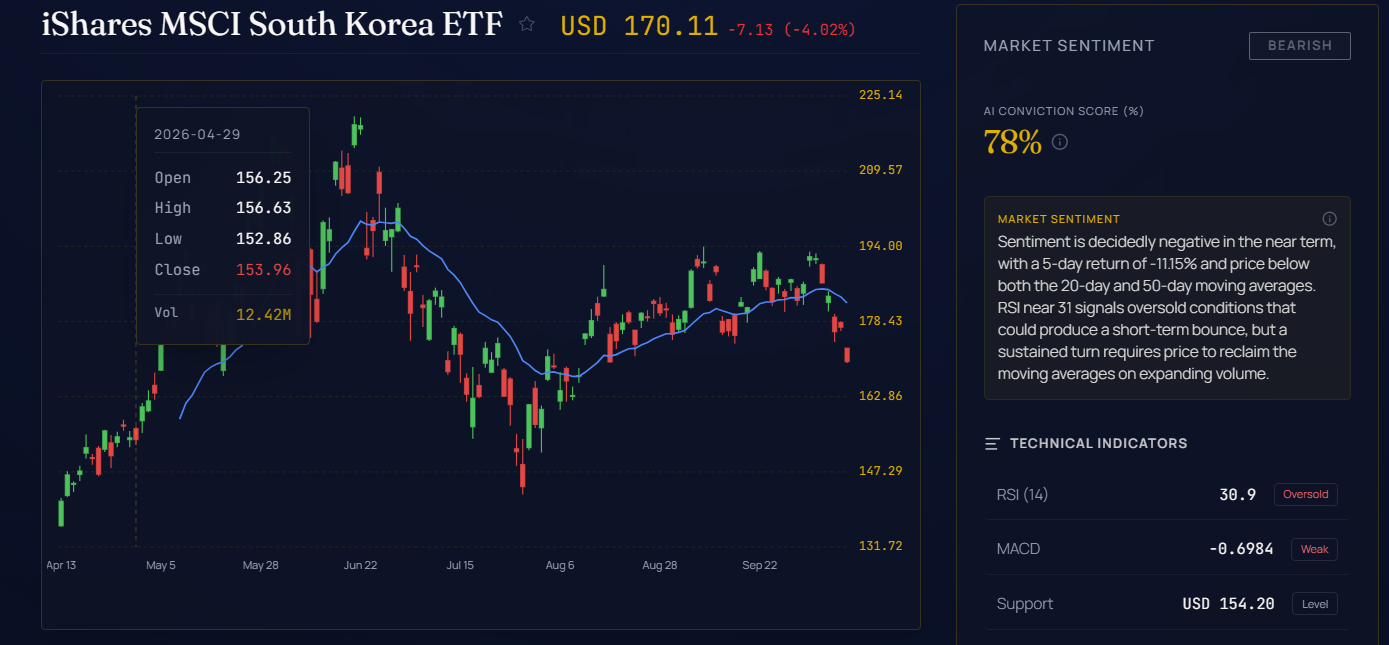
EWY tracks the MSCI Korea 25/50 Index and is one of the main ways to hold Korean large and mid-caps through a US-listed fund. Samsung Electronics and SK hynix are among its biggest holdings, so it falls when they do. The AI Stock tool shows it at USD 170.11 (−4.02%).
| Indicator | Reading | What it means |
|---|---|---|
| RSI (14) | 30.9 | Near oversold |
| MACD | −0.6984 | Momentum negative |
| 20-day average | USD 183.48 | Price below; also the resistance level |
| 50-day average | USD 179.59 | Price below |
| Support | USD 154.20 | Key level below |
- Down from a June peak. EWY peaked at USD 220.89 on 18 June 2026 and has made lower highs since: a sharp drop to about 192 on 23 June, a lower rebound near 205, then a slide to the 162–170 area.
- Back at the bottom of its range. It is trading around USD 170 after failing to hold the 183–190 zone. Its five-day return is −11.15%.
- A possible base, not confirmed. There is no confirmed reversal pattern such as a double bottom or a higher low.
Is There a Chance for SK hynix and EWY After the Plunge?
There is a case for a short-term bounce, but not yet for a trend reversal. Here is how to read the setup:
The case for a bounce
- Both are oversold (RSI 27.9 and 30.9). After falls this steep, short relief rallies are common as sellers run out.
- SK hynix is sitting on support at USD 161.31, and its selling volume eased during the latest drop.
- The sell-off was driven mostly by sentiment (US chip losses, CXMT headlines and foreign flows), not by a reported fall in SK hynix’s own earnings.
The case for caution
- Both trends are still down: lower highs, lower lows, and prices below the 20-day and 50-day averages.
- If SK hynix breaks USD 161.31, the earlier July–August range (down to about USD 124.8) is the next area on the chart. For EWY, USD 154.20 is the key support.
- Foreign selling and doubts about memory prices may take more than a few sessions to fade.
Levels and signs that would change the picture
| Signal | SK hynix (USD) | EWY (USD) |
|---|---|---|
| Support holds | 161.31 | 154.20 |
| First recovery step: back above the 50-day average | 170.76 | 179.59 |
| Downtrend challenged: back above the 20-day average, ideally on rising volume | 183.53 | 183.48 |
Outside the charts, watch US chip stocks overnight, whether foreign investors turn net buyers of Korean shares again, news on memory-chip prices and CXMT, and Samsung’s and SK hynix’s third-quarter results.
How Malaysian Investors Can Follow These Stocks
- EWY trades in the US, so Malaysian investors with US market access, such as through M+ Global, can trade it in US dollars during US trading hours (night-time in Malaysia).
- Currency risk: you take on both US dollar and Korean won movements.
- Concentration: EWY is heavily weighted to a few chip makers, so it moves sharply with them.
- Risk control: after a fall this fast, prices can swing hard both ways. Decide your position size and exit plan before you trade, not after.
Key Takeaways
- The KOSPI fell 3.65% on 12 October and more than 6% intraday on 13 October, breaking below 6,000 and triggering a sell-side sidecar.
- US chip losses, China’s CXMT DDR5 news, doubts over memory prices and foreign selling drove the drop.
- SK hynix (RSI 27.9) and EWY (RSI 30.9) are oversold, which favours a short-term bounce, but both remain in downtrends.
- Key supports are USD 161.31 for SK hynix and USD 154.20 for EWY; the 20-day averages near USD 183.5 are the levels that would challenge the downtrend.
Frequently Asked Questions
Why did South Korean stocks fall on 13 October 2026?
US chip stocks fell overnight, China’s CXMT announced new DDR5 server memory, investors doubted how long the memory-price upcycle will last, and foreign investors sold Samsung Electronics and SK hynix heavily. The KOSPI fell more than 6% intraday and dropped below 6,000.
What is a sidecar on the Korea Exchange?
It is a short pause on program trading orders that the exchange triggers when KOSPI 200 futures move sharply. On 13 October a sell-side sidecar was triggered at 9:47am, the first in about two months.
Is SK hynix oversold?
Yes. Its 14-day RSI is 27.9, below the usual oversold line of 30. Oversold readings often come before short bounces, but they do not confirm that a downtrend has ended.
What is EWY?
EWY is the iShares MSCI South Korea ETF, a US-listed fund managed by BlackRock that tracks the MSCI Korea 25/50 Index. Its largest holdings include Samsung Electronics and SK hynix.
What levels should I watch for a recovery?
For SK hynix, support at USD 161.31, then the 50-day average at USD 170.76 and the 20-day average at USD 183.53. For EWY, support at USD 154.20, then USD 179.59 and USD 183.48.
Want to trade US-listed stocks and ETFs such as EWY? Message me on WhatsApp and I will walk you through US market access on M+ Global.
Sources: Seoul Economic Daily and KED Global (Yonhap), 13 October 2026; Coinpaper and TradingKey market reports, 12–13 October 2026. Charts and indicators: AI Stock tool (ai.dexterchia.com) at the time of writing. Prices are intraday and will change.
Need Help With This?
If you are an M+ Global client and need help with this process, message me directly — I handle these requests for clients every week.
WhatsApp: +60169059789 | M+ Global Invitation Code: UBZQ
Disclaimer: This article is for informational purposes only and does not constitute financial advice. Always do your own research before making investment decisions.
Want to invest in Bursa Malaysia or US markets? Contact Dexter Chia, an AI Driven Remisier who has 2,200+ clients at Malacca Securities Sdn Bhd (M+ Global). M+ Global Invitation Code: UBZQ | WhatsApp: +60169059789 | Why Choose Dexter?