RSI is usually the first indicator a new trader learns, and the one most consistently misused. The standard explanation is simple, memorable, and will lose you money on Bursa small caps with impressive reliability.
What RSI Actually Measures
The Relative Strength Index compares the size of recent gains against the size of recent losses over a lookback period, conventionally 14 days, and expresses the result from 0 to 100.
The critical word is relative. RSI does not tell you a stock is expensive. It tells you that over the last fourteen sessions, up days have dominated down days, or the reverse.
Why that distinction matters: confusing momentum with valuation is what leads people to short strong stocks and catch falling knives.
Why the 70/30 Rule Fails on Trending Stocks
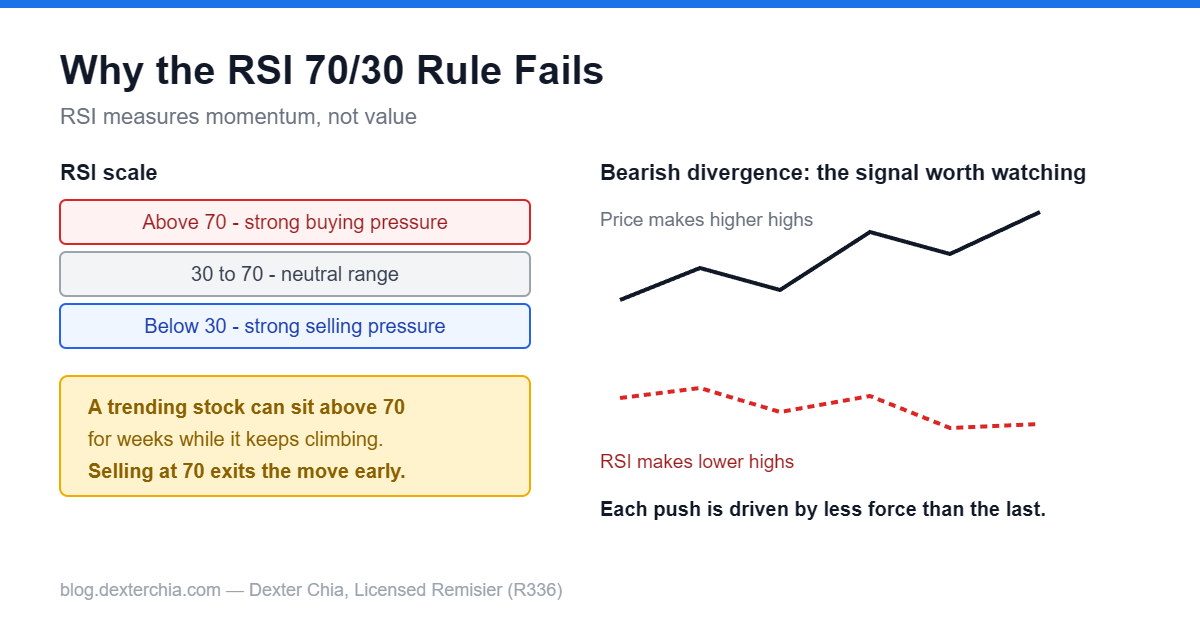
A stock in a genuine uptrend, such as a construction counter that has just won a major contract, will push RSI above 70 and simply stay there. It can remain there for weeks while the price keeps climbing.
So an investor who mechanically sells at RSI 70 exits at the start of the move and watches the rest from the sidelines. Someone who shorts at 70 is betting against the strongest demonstrated demand in the market.
The mirror image applies on the downside. A counter in structural decline can sit below 30 for a month, and every mechanical buy signal is another step down. Persistent oversold readings on a deteriorating business are a warning, not a bargain.
Where the rule does work: range-bound stocks oscillating within an established band. In other words, it works worst precisely when a stock is doing something interesting.
Divergence: The More Useful Signal
Bearish divergence is when price makes a higher high but RSI makes a lower high. The stock is still climbing, but each push is driven by less force than the last. Buyers are tiring.
Bullish divergence is the inverse. Price makes a lower low while RSI makes a higher low. Sellers are still in control but with less conviction.
Divergence warns that conditions are changing. It is not a trade trigger on its own. Its value is in preparing you to act, not telling you to act.
Three Bursa-Specific Cautions
Thin liquidity distorts the reading. On a counter trading a few hundred thousand ringgit a day, one sizeable order can swing RSI meaningfully. The indicator is reflecting a single participant, not market consensus.
Gaps break the calculation. A counter that gaps violently on news produces an RSI dominated entirely by that one session. The number is arithmetically correct and analytically meaningless until several more sessions pass.
News overrides technicals, always. An RSI signal during a contract announcement or earnings surprise is noise. Fundamentals set direction; indicators only describe how price is travelling.
How to Use It Sensibly
RSI earns its place as a secondary input, never a primary one.
Start with why you want to own the business at all. Establish the trend on a longer timeframe, because a reading means something different in an uptrend than a downtrend. Then use RSI to inform timing within that view.
An oversold reading on a stock you already wanted for fundamental reasons is a reasonable entry prompt. An oversold reading on a stock you know nothing about is not a thesis. And if the order book is thin, your entry method matters as much as your timing — see market versus limit orders.
Key Takeaways
- RSI measures the recent balance of buying and selling pressure, not valuation.
- Trending stocks can hold above 70 or below 30 for weeks.
- Mechanically selling at 70 exits strong moves early.
- Divergence between price and RSI is the signal worth watching.
- Thin liquidity and news gaps distort readings on Bursa small caps.
- Use RSI for timing within a view you already hold, never as the view itself.
If you want to talk through how a particular counter looks before you act on an indicator reading, message me. I’m Dexter Chia, remisier at Malacca Securities Sdn Bhd, on WhatsApp at +60169059789 or via M+ Global invitation code UBZQ.
Need Help With This?
If you are an M+ Online or M+ Global client and want to talk this through for your own account, message me directly — I handle these questions for clients every week.
WhatsApp: +60169059789 | M+ Global Invitation Code: UBZQ
Disclaimer: This article is for informational purposes only and does not constitute financial advice. Always do your own research before making investment decisions.
Want to invest in Bursa Malaysia or US markets? Contact Dexter Chia, an AI Driven Remisier who has 2,200+ clients at Malacca Securities Sdn Bhd (M+ Online / M+ Global). M+ Global Invitation Code: UBZQ | WhatsApp: +60169059789 | Why Choose Dexter?