What happened to the SPCX share price?
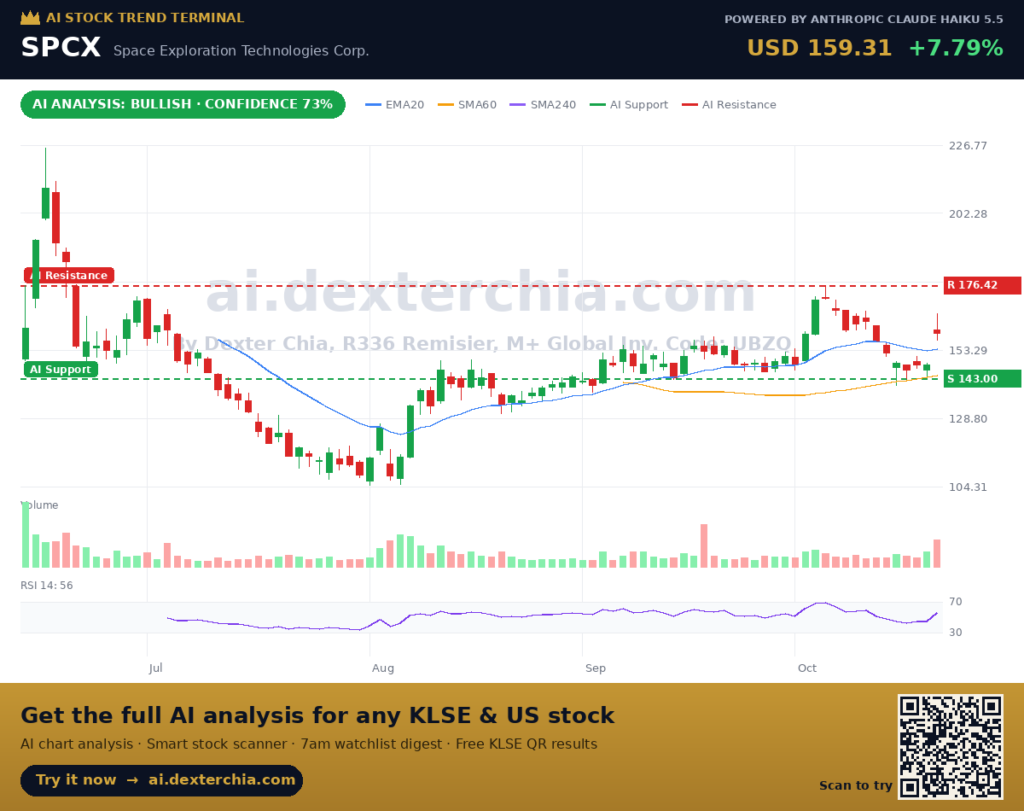
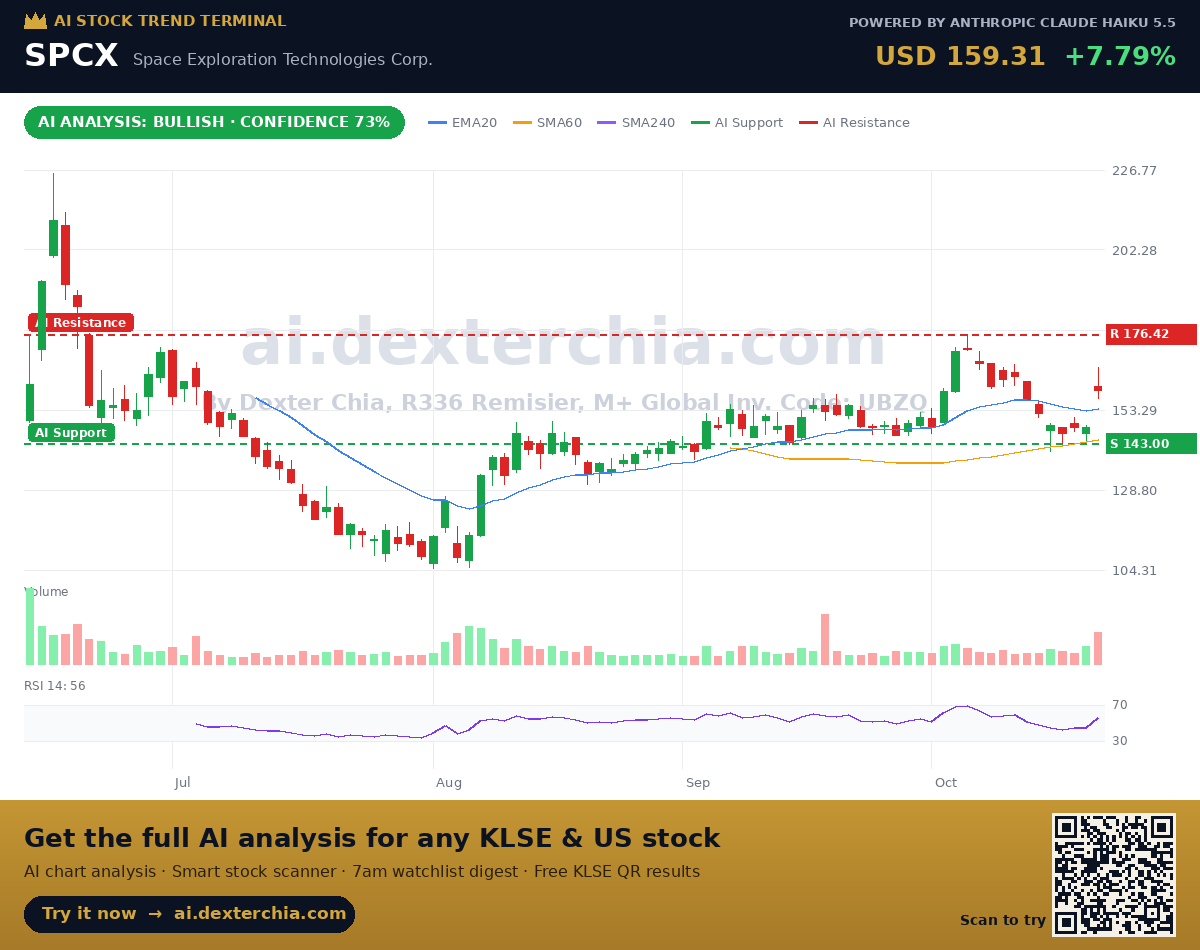
SPCX peaked at 225.64 on 16 June 2026 on heavy trading volume. Over the following weeks the stock fell roughly 54% to a low of 104.83 on 3 August 2026. That drop is the main reason the stock is still volatile today.
The recovery since then has been steady. On the latest session, the stock gained 7.79% on 2.36 times its 20-day average volume. Over the past five sessions it is up 4.70%, and over the past 20 sessions it is up 7.38%. At 159.31, the price is still about 29% below its June peak.
What does the AI analysis say about SPCX?
The AI Stock Terminal, which uses the Claude Haiku 5.5 model, classifies the trend as bullish with 73% confidence. In its words, sentiment has turned constructive after a sharp correction, but the recovery is not yet fully confirmed.
The terminal notes that price sits above both the EMA20 and the SMA60, two common trend lines. It also notes that the stock is extended after its 7.8% one-day move and remains in a volatile recovery. Those points are part of the reading, so a strong session is not treated as proof of a new trend.
What is the SPCX chart pattern?
The chart shows a post-spike correction followed by a V-shaped recovery. Since the 3 August low, SPCX has printed higher lows at 104.83, 105.11, 130.17 and 140.66. It has also printed higher highs at 126.71, 133.48, 149.60 and 176.42. Together, these suggest a rebuilding uptrend.
In September the price moved sideways in a range of about 136 to 156. It then broke out to 176.42 on 6 October, pulled back to 140.66, and is now rebounding toward the upper part of that range. The terminal calls this a partial bullish pattern. It could be a rising channel or a bull flag, but the stock has not yet broken above the June peak of 225.64.
What are the key SPCX price levels?
The table below lists the levels the terminal and the indicators point to. Each indicator is explained briefly after the table.
| Level | Price |
|---|---|
| Current price | 159.31 |
| AI support | 143.00 |
| AI resistance | 176.42 |
| EMA20 | 153.84 |
| SMA60 | 144.31 |
| SMA240 | N/A |
| 52-week high | 225.64 |
| 52-week low | 104.83 |
| RSI 14 | 58.1 |
EMA20 is the exponential moving average of the last 20 sessions. It gives more weight to recent prices, so it reacts faster than a simple average. SMA60 is the simple average of the last 60 closing prices and shows the medium-term trend. SMA240 is the 240-session simple average, a longer-term trend guide. RSI 14 is the 14-session Relative Strength Index, a momentum gauge from 0 to 100. Readings above 70 are often called overbought and below 30 oversold. At 58.1, SPCX sits in the middle zone, with momentum firm but not stretched.
The average true range over 14 sessions (ATR 14) is 8.24, which measures how far the stock typically moves in a day. The MACD is currently below its signal line, which means short-term momentum has not yet turned up on that measure.
What levels should readers watch next on SPCX?
The terminal’s levels give three scenarios to track. These are levels to watch, not forecasts.
- Bullish confirmation: a daily close above 176.42 would be the breakout the terminal is watching, with the June high of 225.64 as the next major reference.
- Support test: the 143.00 zone sits close to the SMA60 at 144.31. A pullback into this area would test whether the rebound structure holds.
- Weakening case: a daily close below 143.00 would break the support the terminal marks and weaken the bullish case.
Between these levels, the price sits in a range where the EMA20 at 153.84 is a nearby reference point. Volume and daily closes will matter more than any single session.
What does SpaceX do, and what are its main strengths and risks?
Space Exploration Technologies Corp. (SpaceX) was founded in 2002 by Elon Musk. It designs, manufactures and launches rockets and spacecraft. Its main offerings include the Falcon 9 and Falcon Heavy launch vehicles, the Dragon spacecraft for crew and cargo missions to the International Space Station, the Starlink low-earth-orbit satellite broadband constellation, Starship (a fully reusable launch system in development), and Starshield for government and defense customers. The company operates mainly in aerospace and satellite communications, and is classified under Industrials and Aerospace & Defense.
Strengths:
- A dominant position in commercial orbital launch, with reusable Falcon 9 boosters that reduce launch costs.
- Starlink, a large recurring-revenue satellite broadband business with global reach.
- Deep government and defense relationships, including NASA crew and cargo contracts and national security programs.
Risks:
- High valuation and volatility, as shown by the 54% drop from the June peak to the August low.
- Heavy capital requirements for Starship development and satellite constellation replacement.
- Regulatory, safety and launch-failure risks, along with dependence on a small number of key contracts and a single leader.
Frequently Asked Questions
Is the SPCX chart bullish?
The AI Stock Terminal reads the chart as bullish with 73% confidence. The reading is based on higher lows and higher highs since August, and on price trading above the EMA20 and SMA60. The terminal also says the recovery is not yet fully confirmed.
What does an RSI 14 of 58.1 mean?
RSI 14 measures momentum on a scale of 0 to 100 over 14 sessions. A reading of 58.1 sits between the oversold zone (below 30) and the overbought zone (above 70), which suggests firm but not extreme momentum.
What price would confirm a breakout in SPCX?
According to the AI Stock Terminal, a daily close above 176.42 would confirm a breakout toward the June highs. The stock’s June peak was 225.64, so a breakout to that level would still be a long way from the current 159.31.
Readers can run the same AI chart analysis on any KLSE or US stock at AI Stock Terminal (ai.dexterchia.com), and open an M+ Global trading account with invitation code UBZQ (sign up here).
This is an AI-assisted technical reading for education only, not investment advice or a recommendation to buy or sell any security. Prices can move quickly; check live prices before acting.