Explore our in-depth analysis, practical tips, and expert advice to embark on a journey towards trading success.
Introduction
Welcome to the gateway of trading success! In the dynamic world of financial markets, understanding candlestick charts can be your key to making informed and strategic trading decisions. In this comprehensive guide, we’ll unravel the secrets behind candlestick charts, providing you with the knowledge and skills to trade like a seasoned professional.
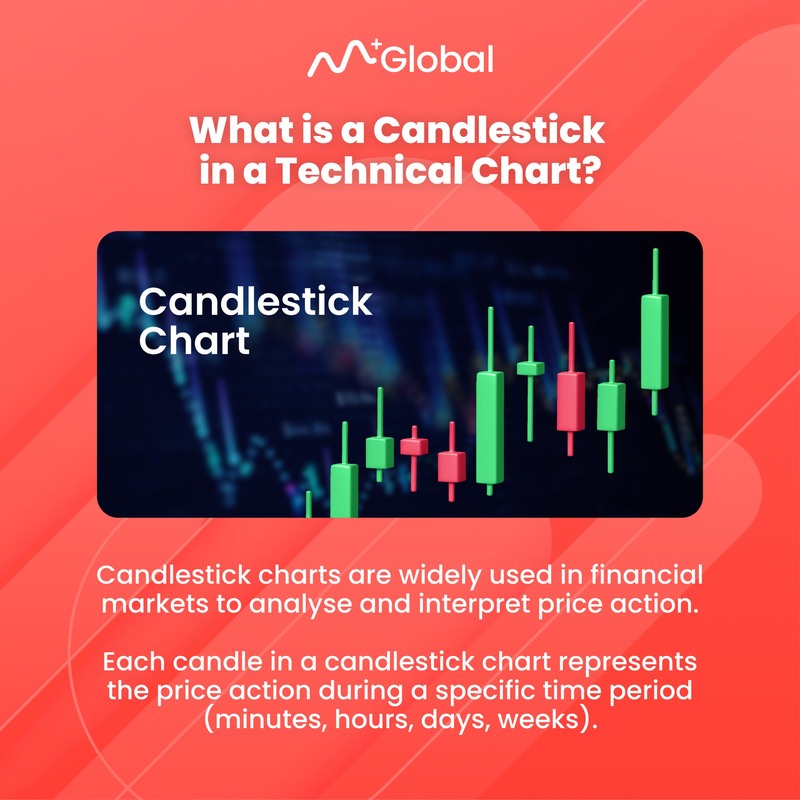
Each candle in a candlestick chart represents the price action during a specific time period (minutes, hours, days, weeks).
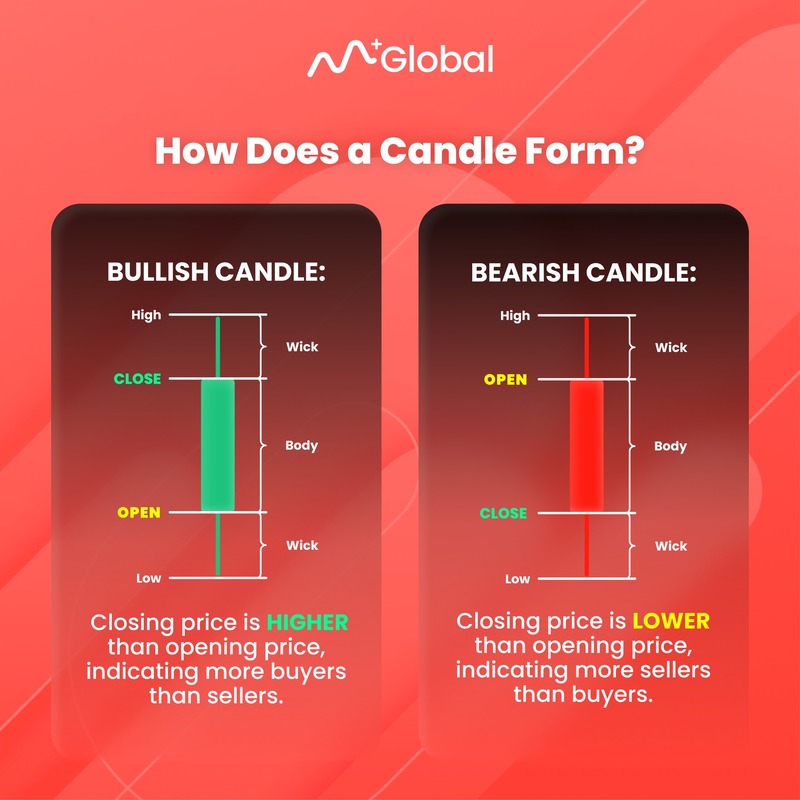
Closing Price is Higher than opening price, indicating more buyers than sellers.
Closing Price is Lower than opening price, indicating more sellers than buyers.
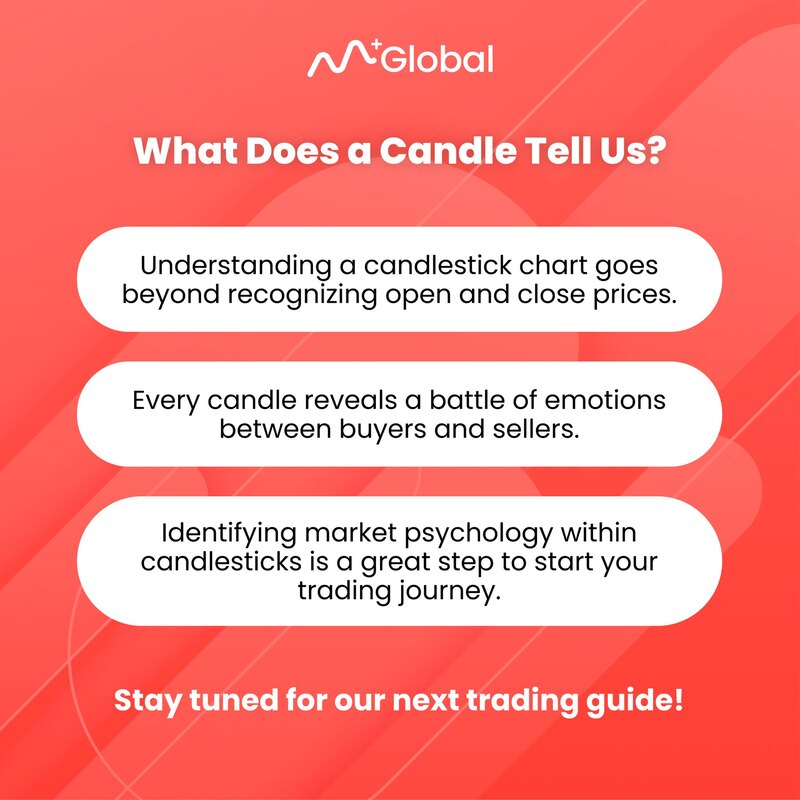
As we conclude this guide, you’ll be equipped with the knowledge and skills to navigate the markets with confidence. Whether you’re a beginner seeking a solid foundation or an experienced trader looking to refine your strategies, mastering candlestick charts is an invaluable asset on your path to trading success.
How to Sign Up Foreign Stock Trading Account Online?
1. Scan / Download M+ Global
2. Sign up using your phone number
3. Put in my Invitation Code: UBZQ
4. Enjoy my remisier services
Further Reading
- Mastering Call and Put Warrants Trading on M+ Global: A Comprehensive Guide for Beginners
- Unlock Unbeatable Deals and Trading Insights with M+ Global’s Black Friday and Cyber Monday Extravaganza!
- Mastering Structured Warrants: A Comprehensive Course from Bursa Academy!
- Mastering the US Stock Market: Unveiling the 3 Types of Trading Hours in the US – Pre-Market, Post-Market, and Regular Trading Hours